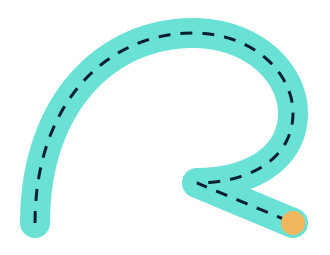

Illustrative urban transport corridor at blue hour

Capabilities

The right intelligence.
For your next decision.

Transport understanding, analytical depth and practical AI—connected around the work your team needs to do.

Transport corridor concept · illustrative artwork
01 / ANALYTICS

Understand how your network works.

Bring scattered transport data into a clear account of performance, patterns and change. We work from the decision you need to make and the evidence available.

  • Corridor travel times, reliability and delay
  • Signal performance and traffic-volume analysis
  • Data quality review and reproducible reporting
Start a conversation about your data
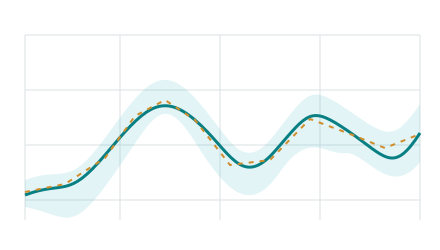
Illustrative morning travel-time profile Departure time runs from 07:00 to 10:00; travel time is in minutes. The teal line is the median and the shaded band spans the 10th to 90th percentiles. The sample median peaks at 13 minutes at 08:00. These are illustrative values, not measured project data. SAMPLE TRAVEL TIME Median 10–90% range Minutes 061218 07:0008:0009:0010:00 Departure time Illustrative travel times
Illustrative profile · actual measures depend on your data.
02 / PLANNING

Make change easier to examine.

Compare defined demand, mode-share or network scenarios with transparent assumptions. Explore the sensitivity of the results before drawing conclusions.

  • Performance–demand relationships
  • Road-closure and network-change comparisons
  • Scenario dashboards and technical interpretation
Discuss a scenario
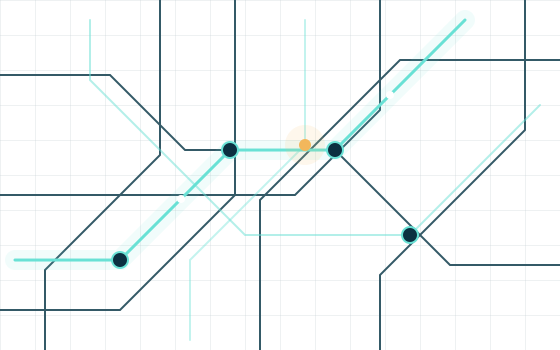
Schematic baseline route and proposed diversion A dashed baseline route joins the origin and destination directly. A closure on its central link requires a proposed teal diversion via two lower junctions. The diversion connects the same origin and destination. This schematic does not represent a real location. COMPARE A CLOSURE SCENARIO Baseline Diversion Origin Destination Closed link Same endpoints · different route Illustrative network
Conceptual network · links do not represent a real location.
03 / COMPUTER VISION

Turn footage into transport evidence.

Computer vision can help structure what a camera observes. We explore detection, classification and movement analysis with a clear evaluation and review process.

  • Vehicle and pedestrian observation workflows
  • Survey summaries and candidate-event review
  • Testing across camera views and operating conditions
Discuss video analysis
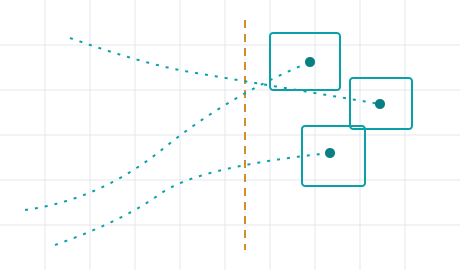
Schematic detections, movement directions and review flag A rectangular observation frame contains three separate generic detection boxes numbered 01, 02 and 03. Arrows show movement directions toward a vertical dashed counting line. Detection 03 is amber and is explicitly flagged for review. These are sample observation geometries, not footage, measured counts or model results. SAMPLE OBSERVATIONS Frame 01 01 02 03 Review 03 Detection Count line Direction Schematic detection geometry
Illustrative detections and traces · not measured survey results.
04 / AI & KNOWLEDGE

Give information a useful job.

Connect language models, approved knowledge and analytical tools to support repeatable transport work. Build the review point into the workflow from the start.

  • Source-linked project knowledge retrieval
  • Draft briefings and technical reporting
  • Agentic workflows with defined permissions and review
Explore AI co-worker roles
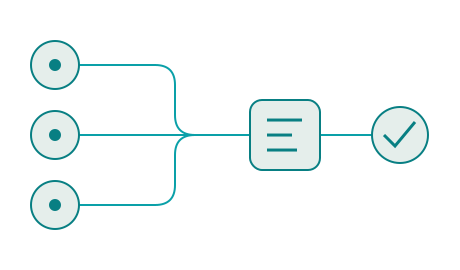
Illustrative draft answer linked to numbered source notes Three sample sources are shown: 1, Survey; 2, Scenario; and 3, Checks. The draft says 'Review entry counts' with citations 1 and 3, and 'Test diversion options' with citation 2. Every citation corresponds to a displayed source number. The documents and draft text are illustrative and need source review. SOURCE-LINKED ANSWER Sources Draft answer 1 Survey 2 Scenario 3 Checks Review entry counts. [1] [3] Test diversion options. [2] Check the original notes Illustrative sources and answer
Connected inputs, analytical work and a reviewable output.
05 / DATA ENGINEERING

Build on evidence you can inspect.

Reliable analysis begins with understanding the data. We examine structure, coverage and consistency, then prepare the records and methods needed for the work.

  • Data integration, preparation and validation
  • Repeatable processing and clear data lineage
  • Documented assumptions and limitations
Discuss a data challenge
Sample data pipeline with validation and a review branch Three illustrative sources provide 40 sensor records, 35 survey records and 25 file records: 100 input records in total. Schema, time and field checks pass 92 records into the checked dataset. The other 8 records are held out for review. The two branches sum exactly to the 100 input records. Counts are samples only. SAMPLE VALIDATION FLOW Sensors 40 rows Surveys 35 rows Files 25 rows Checks Schema Time Fields Checked dataset 92 rows Review 8 rows Held out 100 in = 92 checked + 8 for review
Illustrative comparison · data checks precede interpretation.

Ways to work together

A practical
place to start.

Start with a clear question, an agreed scope and an output your team can use.

Bring us your transport question.

Let’s work out what the evidence can tell you.

Discuss a project